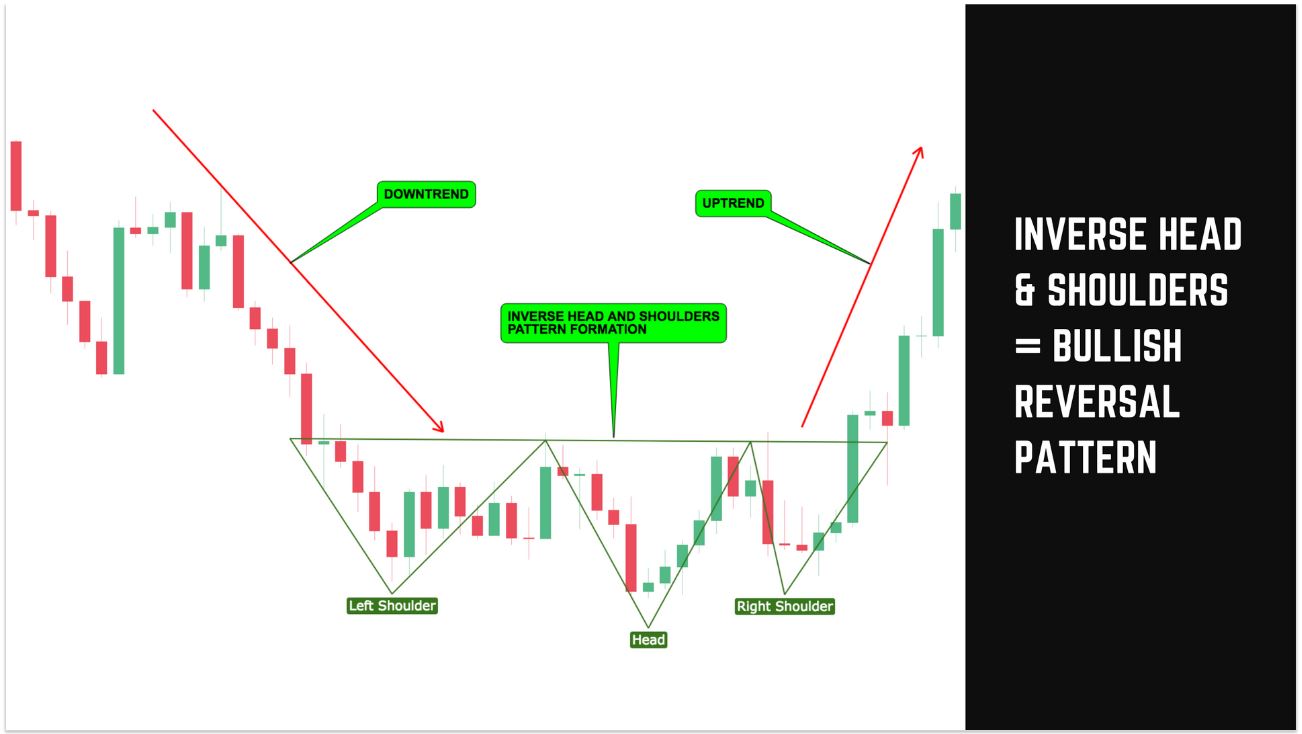
In technical terms, a chart pattern is a recognisable structure in a price chart that can be used to predict future price movement based on current and prior data. Technical analysis relies heavily on spotting and reacting to recurring patterns in chart data, which demands a thorough understanding of both the data and the patterns themselves.
Here are the 8 most profitable chart patterns every trader needs to know
1. Double Top Pattern
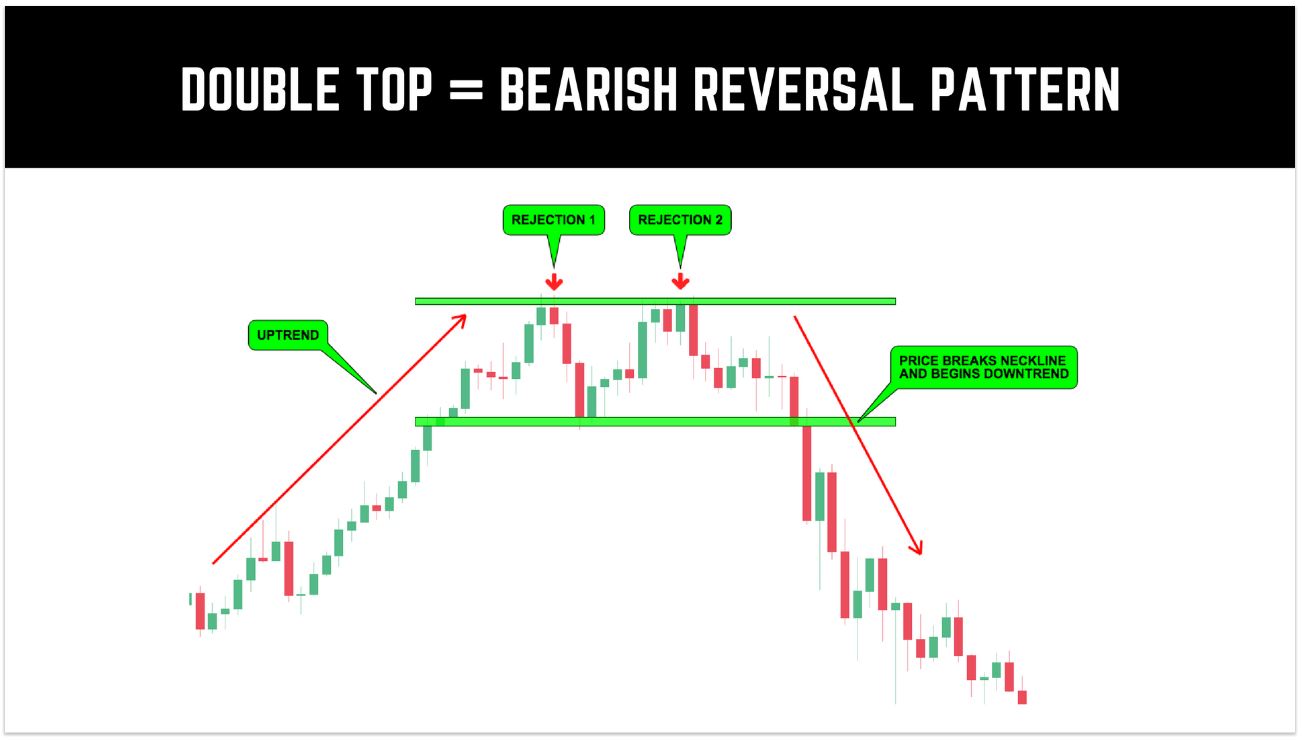
2. Double Bottom Pattern
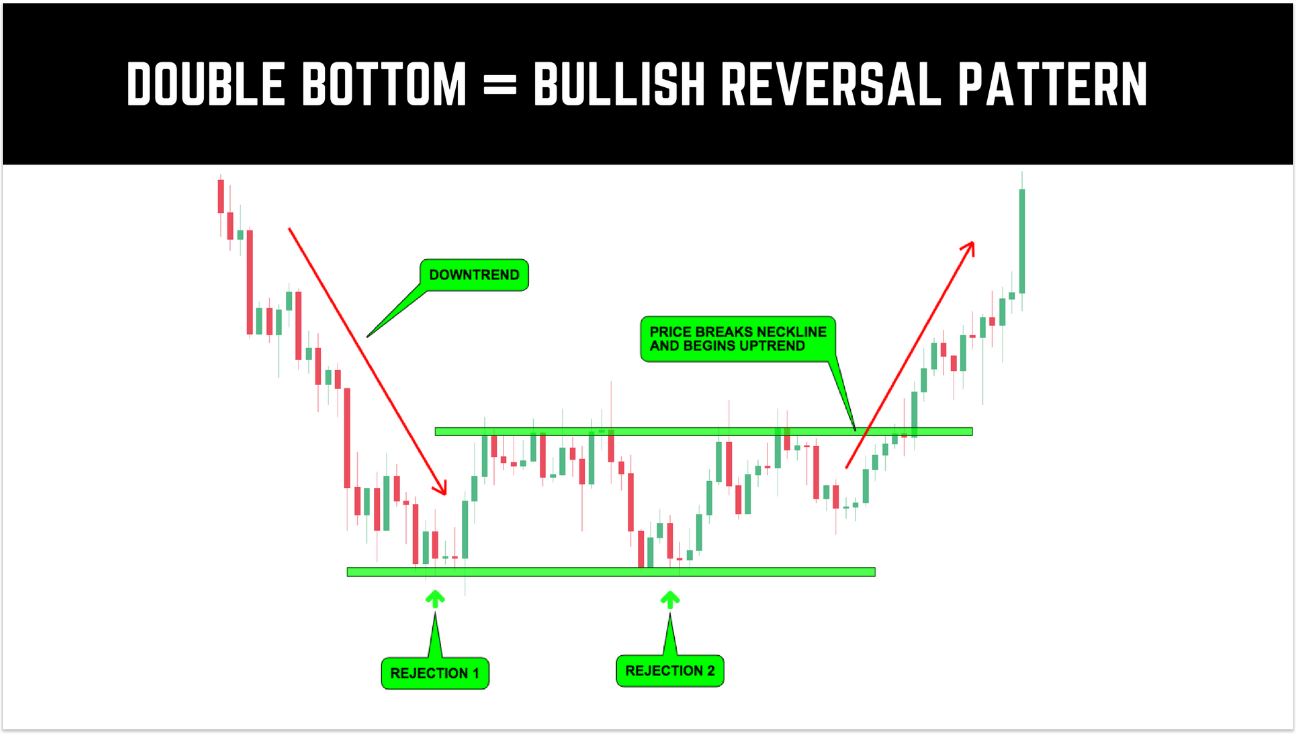
3. Falling Wedge Pattern
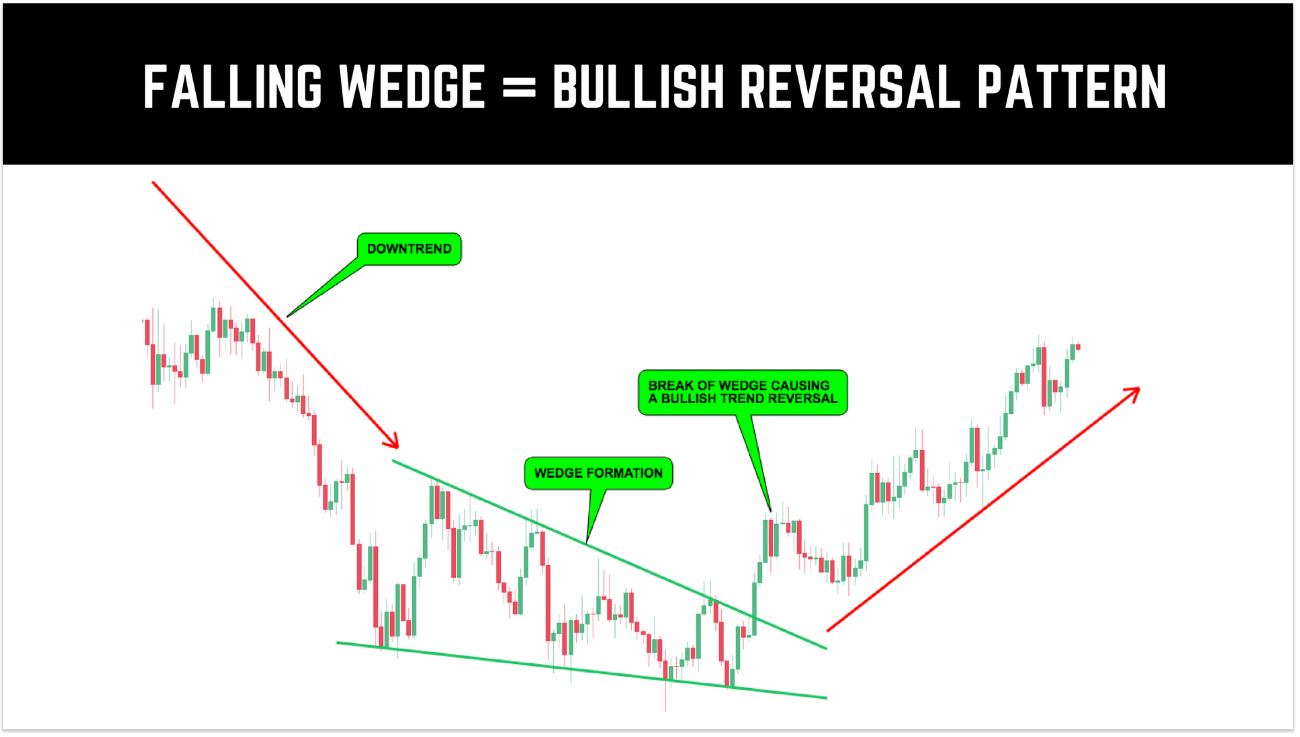
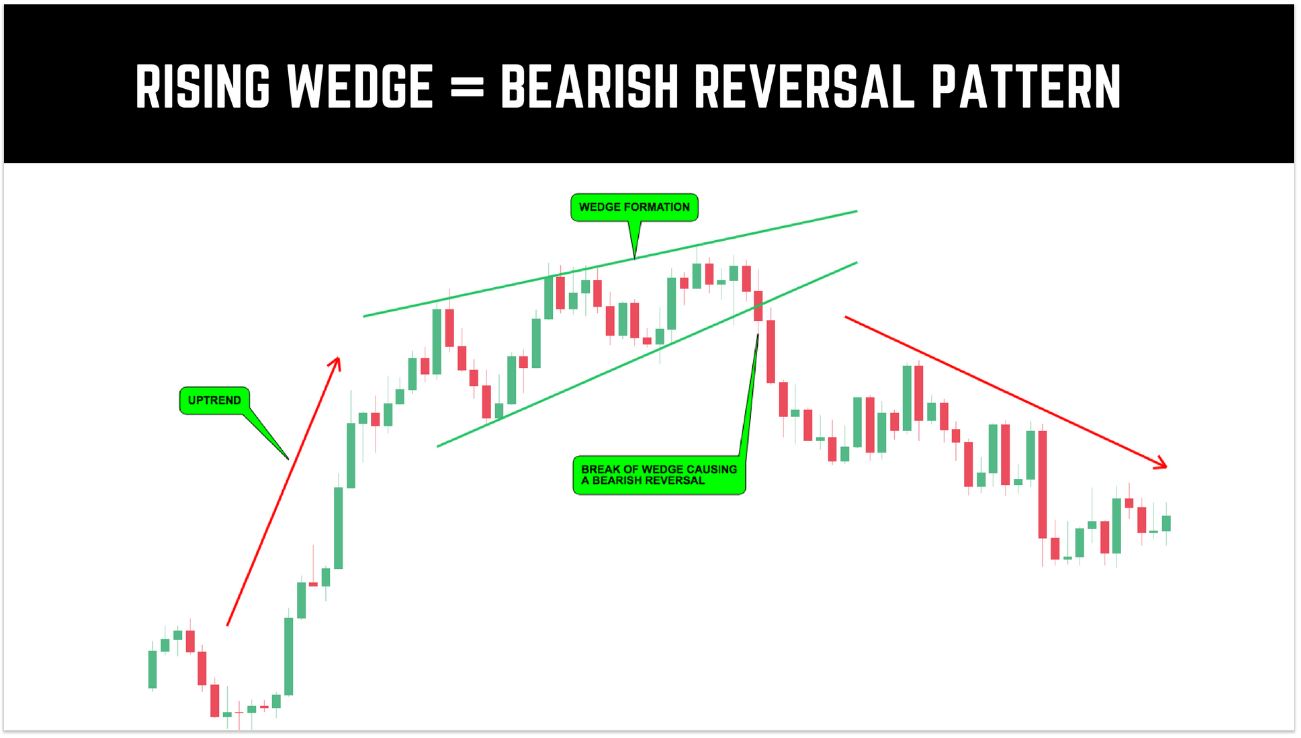
4. Rising Wedge Pattern
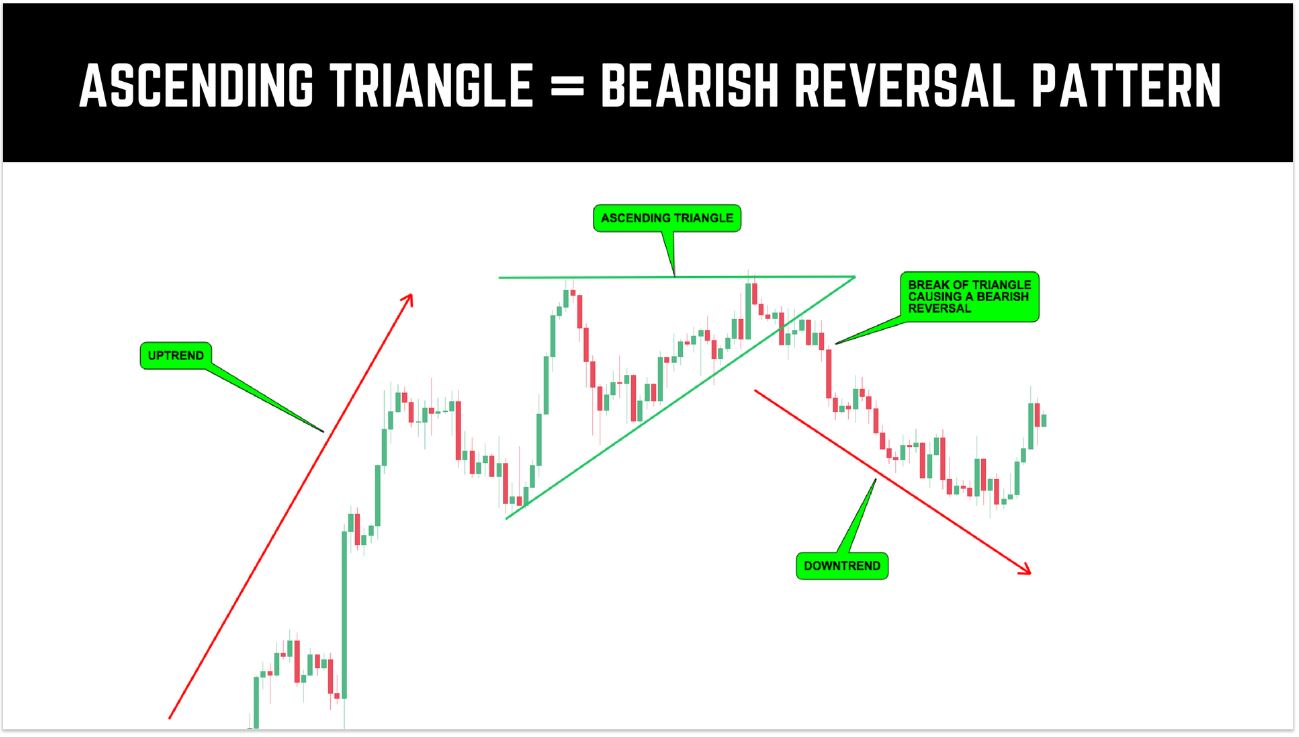
5. Ascending Triangle Pattern
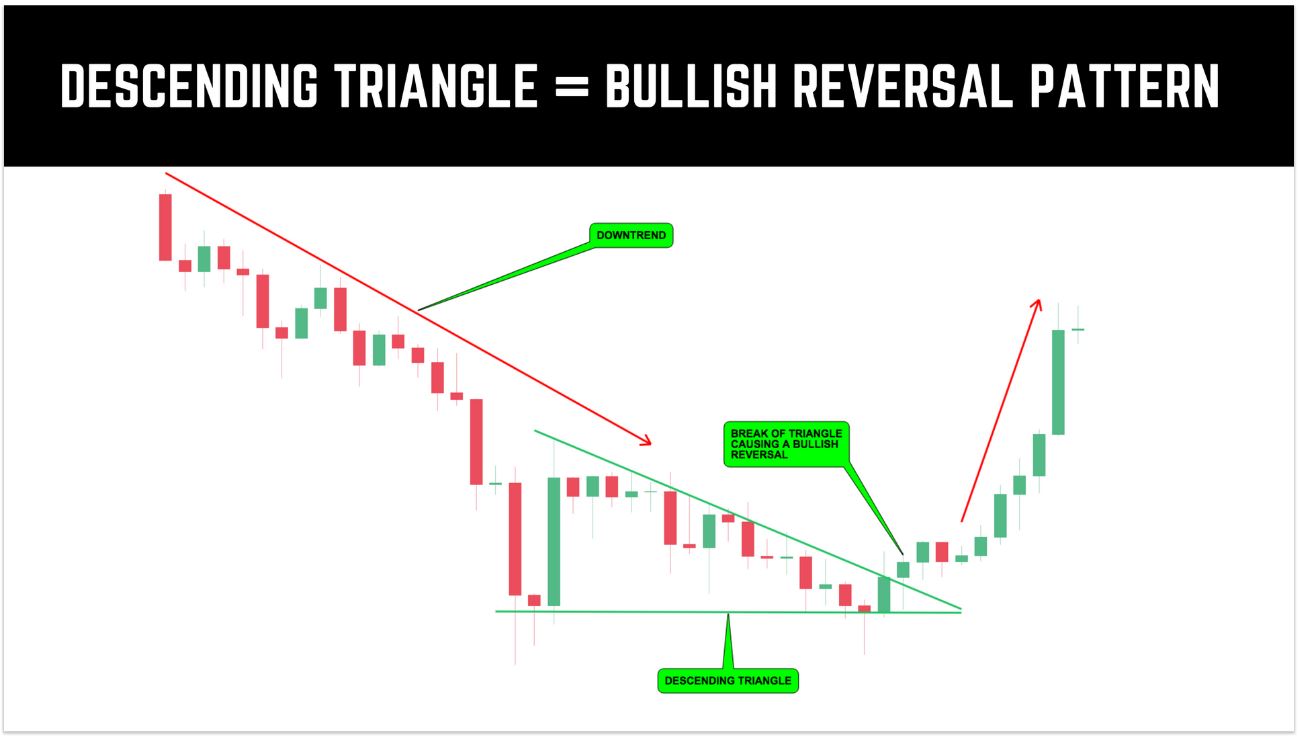
6. Descending Triangle Pattern
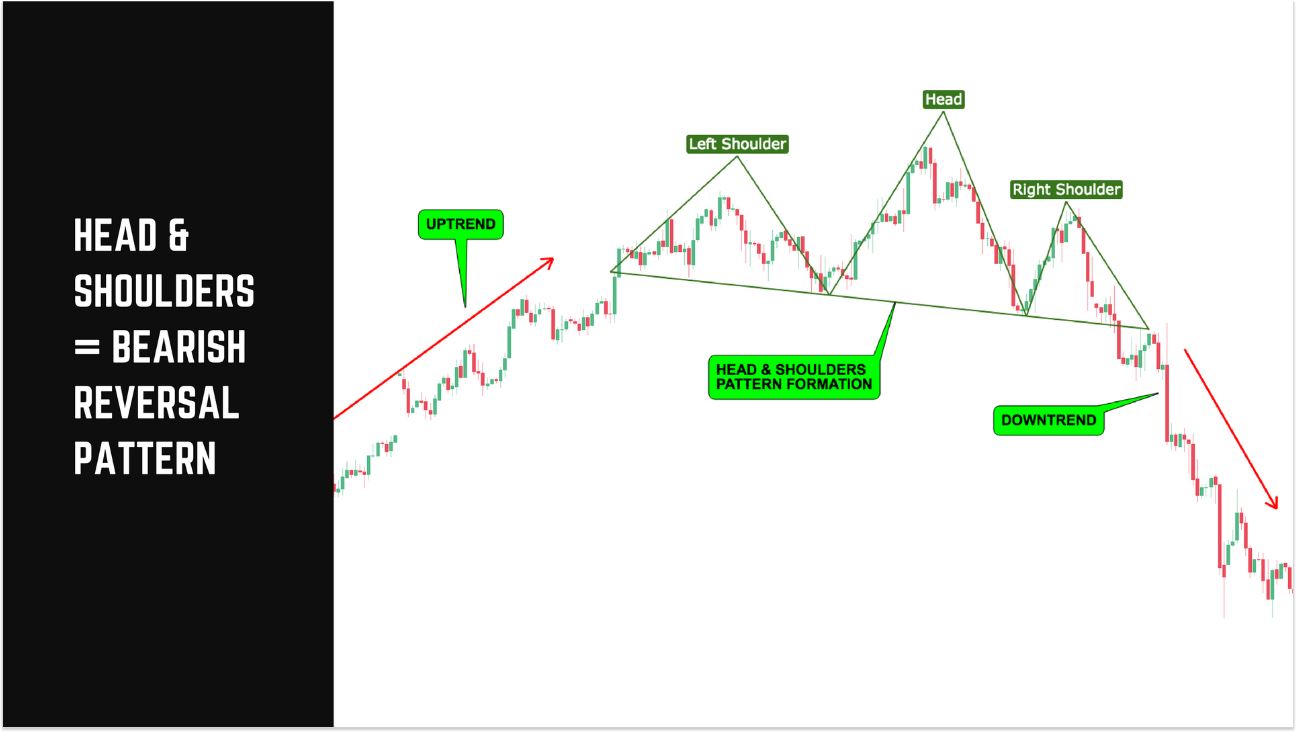
7. Head & Shoulders Pattern
8. Inverse Head and Shoulders Pattern
