Did you know the inside candle pattern is a key tool for traders? It helps them make consistent profits. This simple candlestick formation uncovers secrets of price action trading, improving your trading results.
As a professional trader, I’ve seen the inside candle pattern’s power. It gives you an edge in the financial markets. In this guide, I’ll show you how to master inside candle pattern trading. You’ll learn to make better decisions for long-term success.
Key Takeaways
- The inside candle pattern is a powerful technical analysis tool that can provide valuable insights into market dynamics.
- Understanding the origins, structure, and psychology behind inside candles is crucial for effective trading strategies.
- Mastering the art of trading inside bars can help you capitalize on market opportunities in trending and consolidation periods.
- Implementing robust risk management and position sizing techniques is essential for optimizing your inside bar trading approach.
- Exploring common inside bar pattern variations can further enhance your trading versatility and decision-making.
Understanding the Inside Candle Pattern
The inside candle pattern is a significant concept in Japanese candlestick trading. It serves as a valuable tool for traders to detect market shifts and leverage price fluctuations. Gaining a clear understanding of its structure and the psychology behind it can greatly enhance trading strategies.
-Historical Roots in Japanese Candlestick Trading
The origin of candlestick charts can be traced back to Japanese rice traders centuries ago. These charts revolutionized the way market data was represented, providing a visual representation of price movements. The patterns within these charts help traders identify trends and make informed decisions.
-Anatomy and Formation of the Inside Candle Pattern
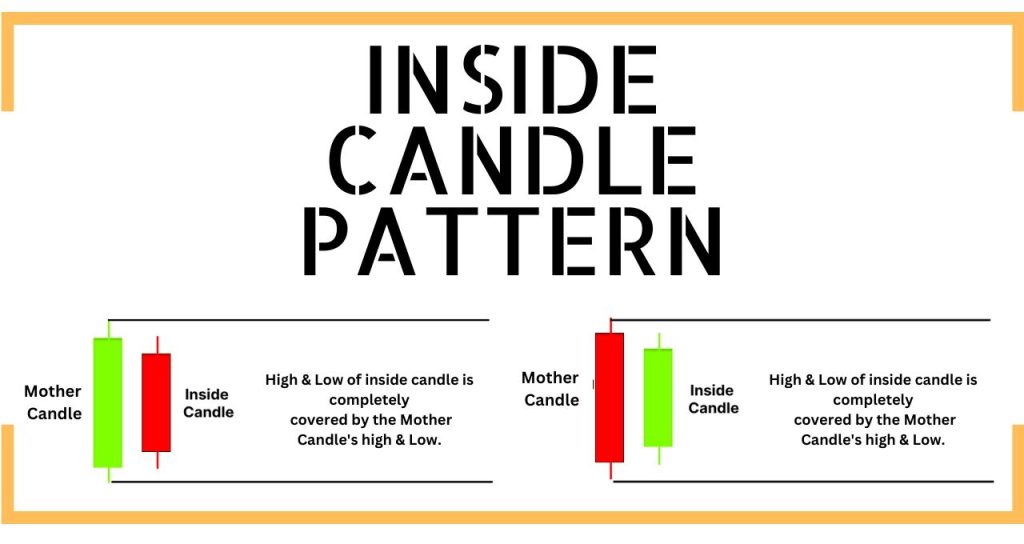
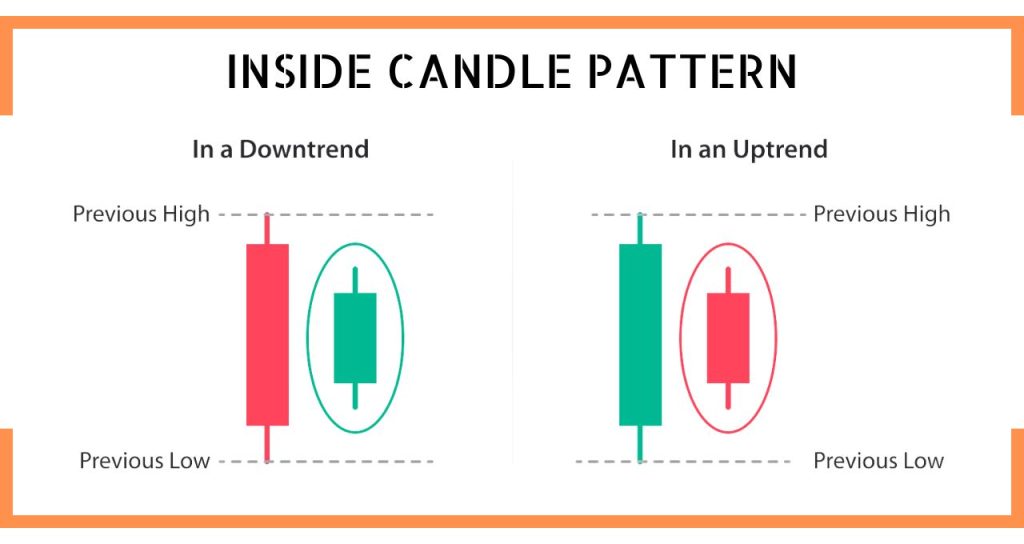
The inside candle pattern forms when a smaller candlestick is completely engulfed within the body of the preceding candle. This pattern represents a phase of uncertainty or hesitation in the market. The dimensions and placement of the inside candle offer critical insights into price action and support technical analysis.
-Psychological Implications of Inside Candles
The inside candle pattern reflects a shift in market sentiment. During its formation, traders often exhibit caution, pausing to assess potential market direction. Understanding this psychological aspect equips traders with the ability to anticipate market behavior and seize emerging opportunities effectively.
How to Trade Inside Candle Pattern?
The inside candle pattern is a key tool for traders looking for reliable signals and strategies. It helps you spot good times to enter the market. This knowledge can give you an edge over others.
To trade the inside candle pattern, first, look for a candle fully inside the previous one’s range. This shows the market is unsure, which can lead to a big move. It’s a good time to start a trade.
- Identify the mother candle: Look at the big candle that holds the inside one. Check its size, color, and where it sits in the trend.
- Assess the inside candle size: A small inside candle means a big signal. It shows the market is getting tight and tense.
- Consider the trading volume: Watch the volume during the inside candle. It tells you about the strength and confidence behind the pattern.
| Trend Condition | Entry Signal | Exit Strategy |
|---|---|---|
| Bullish Trend | Long position on a breakout above the inside candle’s high | Set a profit target based on the size of the mother candle and manage the trade with a trailing stop-loss |
| Bearish Trend | Short position on a breakout below the inside candle’s low | Set a profit target based on the size of the mother candle and manage the trade with a trailing stop-loss |
Learning to trade the inside candle pattern opens up many market opportunities. It boosts your trading skills by using trade entry signals and intraday trading strategies wisely.
“The inside bar pattern is a powerful tool in the arsenal of any technical analysis enthusiast, offering a window into the market’s pulse and potential future direction.”
By understanding the mother candle, the inside bar’s size, and volume, traders can make better choices. This can help them succeed in the fast-paced world of Price Cction Trading.
Time Frame Selection for Optimal Trading
Choosing the right time frame is key in intraday trading strategies and using the Inside Candle Pattern. The time frame you pick can greatly affect how well you spot patterns, make trading decisions, and your profits.
When picking a time frame, think about how volatile the market is and how clear the patterns are. Shorter time frames, like 5-minute or 15-minute charts, give you more chances to trade. But, the patterns might be clouded by market noise and false signals. On the other hand, longer time frames, like hourly or daily charts, show clearer patterns. But, you might not get to trade as often.
- Shorter time frames (5-minute, 15-minute): More frequent trading opportunities, but increased market noise and potential for false signals.
- Longer time frames (hourly, daily): More stable and well-defined patterns, but fewer trading opportunities.
The best time frame for trading the Inside Candle Pattern is often in the middle, like 30-minute or 1-hour charts. These times offer a good balance between clear patterns and enough trading chances. This way, traders can spot reliable signals and make smart choices without getting lost in too much market movement.
“The key to successful intraday trading strategies is finding the right balance between pattern recognition and market dynamics.”
What time frame you choose depends on your trading style, how much risk you’re willing to take, and what you like. Try out different time frames and see how they work for you. This will help you find the best way to do your technical analysis and intraday trading strategies.
Trading Inside Bars in Trending Markets

Trading inside bars in trending markets is a key skill for price action traders. These bars offer insights into market sentiment and future price movements. They are especially useful for spotting bullish or bearish patterns.
Bullish Trend Scenarios
In a bullish market, an inside bar can signal more upward momentum. Traders can analyze the size, volume, and position of the inside bar. This helps identify support areas and the best times to enter the market for profit.
Bearish Trend Applications
In a bearish market, inside bars hint at a possible reversal or consolidation. Traders can spot bearish patterns in these bars. This information helps them decide when to short or wait for a clearer trend.
Consolidation Period Analysis
During consolidation, inside bars reveal the fight between buyers and sellers. By studying the price action trading in these bars, traders can predict breakouts. This timing is crucial for entering and exiting trades effectively.
| Trend Scenario | Potential Implications | Key Considerations |
|---|---|---|
| Bullish Trend | Inside bar pattern may signal continuation of upward momentum | Analyze size, volume, and positioning of inside bar relative to previous candles |
| Bearish Trend | Inside bar pattern may indicate potential reversal or consolidation | Identify bearish patterns and assess overall market conditions |
| Consolidation Period | Inside bar pattern can provide insights into the battle between buyers and sellers | Examine price action within the inside bar pattern to anticipate potential breakouts |
Understanding inside bars in different markets can improve trading strategies. This knowledge leads to more consistent and profitable trading results.
Entry and Exit Strategies for Inside Bar Trading
Creating good entry and exit plans is key in Inside Bar trading. Knowing how this pattern works helps traders make the most of it and keep their risks low.
Identifying Entry Signals
Finding the right entry signals is crucial for Inside Bar trading success. Here are some tips:
- Breakout Approach: Watch for the market to break out of the Inside Bar. This shows a possible trend continuation. Enter the trade in the breakout direction.
- Reversal Technique: Look for Inside Bars at key support or resistance levels. A breakout in the opposite direction might signal a trend reversal.
- Confluence Analysis: Check if the Inside Bar matches other technical indicators like moving averages or oscillators. This confirms the trading signal.
Exit Strategies for Inside Bar Trades
Exiting trades well is as important as finding good entry points. Here are some exit strategies:
- Trailing Stop-Loss: Use a trailing stop-loss order to keep profits safe and manage risk as the trade goes on.
- Target-Based Exits: Set profit targets based on the Inside Bar size or other technical analysis.
- Time-Based Exits: Close positions after a set time, like the end of the trading session or a certain holding period.
Success in Inside Bar trading comes from a balanced approach. It includes good trade entry signals, risk management, and intraday trading strategies. By mastering these, you can confidently trade the markets and use the Inside Bar pattern’s opportunities.
Risk Management and Position Sizing
As a professional trader, managing risk is key to your success. Trading the inside bar pattern requires careful risk management. This section will cover strategies for stop loss placement, profit target calculation, and improving your risk-reward ratio. These steps are crucial for consistent and profitable trading.
Stop Loss Placement Techniques
Finding the right stop loss level is vital. For inside bar patterns, place the stop loss below the low for bullish setups. For bearish setups, place it above the high. This protects your position if the trade goes against you.
Profit Target Calculation
Setting your profit target is just as important. A common method is to use the mother candle’s height. For example, in a bullish setup, aim for a profit equal to the mother candle’s height from the inside bar’s low. This can lead to a good risk-reward ratio and higher gains.
Risk-Reward Ratio Optimization
By combining stop loss and profit target strategies, you can improve your risk-reward ratio. Aim for a ratio of at least 1:2, where your profit is twice your loss. This can help you make consistent profits in your intraday trading strategies and technical analysis.
Effective risk management is essential for trading success. By mastering these techniques, you’ll improve your use of the inside bar pattern. This will help you consistently make profitable trades.
Common Inside Bar Pattern Variations
The inside bar is a key candlestick pattern in trading. It can show up in different ways, each with its own meaning. Understanding these variations is key for traders.
The mini inside bar has a tiny body compared to the main candle. It often means the market is settling down. This can be a good time to trade with a smaller risk.
The inverted inside bar shows up when the inside bar’s body goes above and then below the main candle’s range. This can hint at a change in market direction. It’s a sign to be careful with your trades.

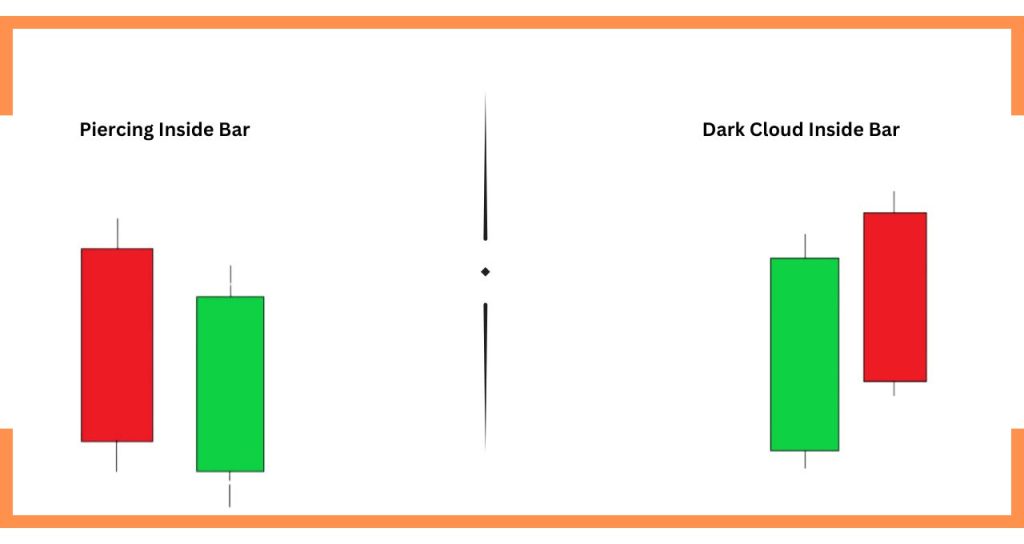
- The piercing inside bar is a bullish sign. It happens when the inside bar’s low goes below the main candle’s low but closes above its midpoint.
- The dark cloud inside bar is bearish. It occurs when the inside bar’s high goes above the main candle’s high but closes below its midpoint.
Knowing these variations helps traders use the inside bar pattern better. It can lead to better trading decisions and results.
| Variation | Description | Potential Implication |
|---|---|---|
| Mini Inside Bar | The inside bar’s body is significantly smaller than the mother candle. | Indicates a period of consolidation and may allow for tighter stop-loss placement. |
| Inverted Inside Bar | The inside bar opens above the previous candle’s high and closes below the previous candle’s low. | Can signal a potential reversal in the market’s direction, warranting a more cautious approach. |
| Piercing Inside Bar | The inside bar’s low penetrates the previous candle’s low, but the close is above the midpoint of the mother candle. | Bullish variation that may indicate a potential reversal or continuation of an uptrend. |
| Dark Cloud Inside Bar | The inside bar’s high penetrates the previous candle’s high, but the close is below the midpoint of the mother candle. | Bearish variation that may indicate a potential reversal or continuation of a downtrend. |
Learning about these all candlestick patterns and their japanese candlesticks variations can boost your trading. It helps you make smarter choices in the markets.
Conclusion
In this guide, we’ve explored the Inside Candle Pattern. It’s a key tool in technical analysis and price action trading. Traders in India can now use this knowledge to make better decisions in the markets.
We’ve looked at the Inside Bar Pattern’s key features. This includes understanding the mother candle and volume. It helps you spot and use these patterns effectively. Also, picking the right time frame for trading is crucial. This ensures your strategies fit the markets you’re in.
As we wrap up, the Inside Candle Pattern is more than just a trading setup. It’s a vital part of a solid trading strategy. By using this pattern, managing risks well, and improving your skills, you can fully benefit from inside candle pattern, technical analysis, and price action trading in India.
FAQ
What is the Inside Candle Pattern, and why is it important for traders?
The Inside Candle Pattern is a tool in technical analysis. It shows market sentiment and future price moves. It’s a pattern where the current candle’s body fits inside the previous one, showing market indecision.
How does the Inside Candle Pattern originate, and what is its basic structure?
It comes from Japanese candlestick trading, showing market psychology. The pattern has a current candle fully inside the previous one. The current candle’s high and low are within the previous one’s.
What is the psychology behind the formation of Inside Candle Patterns?
This pattern shows market indecision and consolidation. It means neither bulls nor bears won, leading to a narrow trading range. This could be a sign of a trend reversal or continuation.
How can traders identify and trade the Inside Candle Pattern effectively?
Traders look for key pattern characteristics like size and market trend position. They use these to enter trades or confirm other strategies. This approach helps in making informed trading decisions.
What are the important considerations when trading Inside Candle Patterns?
Traders must analyze the “mother candle” and the inside candle’s size. Trading volume also plays a role. The time frame used affects the pattern’s reliability and trading opportunities.
How can traders effectively manage risk and size their positions when trading Inside Candle Patterns?
Risk management is key. Traders use stop-loss, profit targets, and risk-reward ratios. This approach keeps trading disciplined and sustainable over time.
What are some common variations of the Inside Candle Pattern, and how can traders adapt their strategies accordingly?
Variations include the Inside Bar, Harami, and Harami Cross. Traders must know these to adjust their strategies. This flexibility helps in trading different market conditions effectively.
