How They Work, When They Fail, and Real Market Use (With Free PDF)

Candlestick patterns are everywhere in trading education. They are taught as simple visual signals that supposedly reveal where price is headed next.
This simplicity is appealing, but it is also the reason many traders struggle when they rely on candlestick patterns alone.
This guide takes a different approach. Instead of repeating textbook definitions, it explains how candlestick patterns behave in real market conditions, why they often fail, and how experienced traders actually interpret them.
A free candlestick pattern PDF is included near the end as a reference tool, but it is not the core of this page. This content is educational and observational in nature. It is not financial advice.
How Candlestick Patterns Really Work
At their core, candlestick patterns are not signals. They are snapshots of behavior.
Each candle shows how buyers and sellers interacted during a specific period of time.
The open, high, low, and close tell a short story about pressure, rejection, hesitation, or control. What they do not tell you is what will happen next.
Many traders expect candlestick patterns to predict price.
That expectation is where most problems begin. In reality, candlestick patterns only become meaningful when they are viewed alongside market structure, trend direction, volatility, and liquidity.
Without that context, a pattern is just a shape on a chart.
To apply candlestick patterns correctly, traders must first configure their charts properly, including selecting the right instruments and timeframes.
You can set up your chart for pattern analysis by following this guide on how to add Nifty 50 stocks to a TradingView watchlist.
For readers who want additional background rather than practical setup, this guide on candlestick patterns and their historical background from Investopedia provides a clear, introductory overview.
Why Candlestick Patterns Often Fail
Candlestick patterns fail frequently, and this is not a secret among experienced traders.
The failure does not mean the pattern is useless. It usually means it was used incorrectly.
Some of the most common reasons patterns fail include trading against a strong trend, ignoring nearby support or resistance, using very low timeframes where noise dominates, and assuming one candle can reverse a move that took days or weeks to form.
A candlestick pattern does not reverse a market. At best, it shows that something changed temporarily.
Candlestick Patterns That Actually Matter

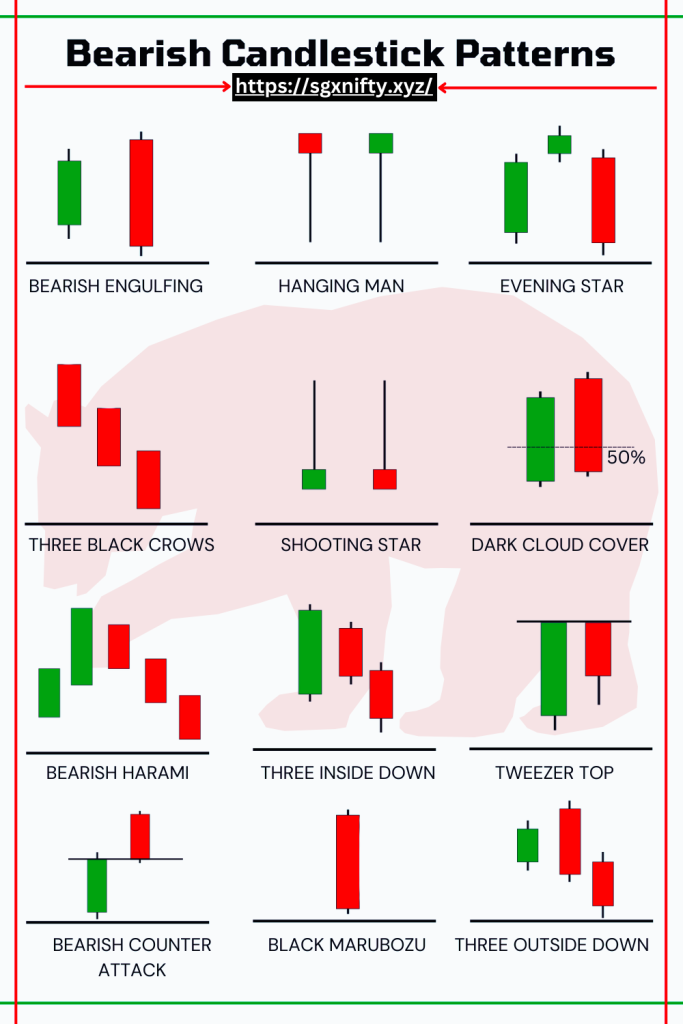
Not all candlestick patterns deserve equal attention. Many exist in theory but add little value in practice.
Certain patterns tend to stand out because they reflect strong rejection or participation when they appear in the right place.
Patterns traders focus on most often include the hammer, shooting star, bullish engulfing, bearish engulfing, morning star, and evening star.
These patterns are not reliable by default, but they can be useful when they form after a clear directional move and near important price levels.
Other patterns, such as doji candles, inside bars, and spinning tops, appear constantly. Most of the time they simply reflect indecision.
Without additional confirmation, they offer very little edge.
Why You Should Never Trade Candlestick Patterns Alone
One of the fastest ways to lose money in trading is to treat candlestick patterns as standalone entry signals.
A single candle does not define risk, does not define reward, and does not explain market structure.
This is why professional traders rarely say they “trade candlestick patterns.”
They use them as filters, not triggers.
A pattern may suggest that selling pressure is weakening or that buyers are stepping in, but the trade decision still depends on confirmation, context, and risk management.
Real Market Behavior: What Works and What Does Not

In live markets, candlestick patterns rarely look as clean as chart examples found in books or courses.
Patterns tend to work better when they appear after emotional or extended moves, when price is approaching a level that previously mattered, and when the next candle confirms participation in the expected direction.
They tend to fail when they form in the middle of ranges, during low-volume periods, or against strong momentum.
Many traders experience repeated losses simply because they expect every visually perfect pattern to perform the same way.
The difference between a useful pattern and a useless one is not the candle itself. It is the environment around it.
Common Mistakes Traders Make With Candlestick Patterns
Most candlestick-related losses come from the same habits repeating over time.
Traders often overtrade small timeframes, assume indicators can fix weak setups, or chase confirmation candles that have already moved too far.
Others focus on win rate instead of risk, forgetting that a pattern can be profitable even if it fails often, as long as losses are controlled. Candlestick patterns do not create consistency. Discipline does.
Risk Management in Candlestick Trading
No discussion of candlestick patterns is complete without addressing risk.
A pattern is invalidated when price moves beyond the level it was supposed to hold.
That invalidation point should define risk. If a trader cannot clearly define where the pattern is wrong, the trade should not exist.
Good risk management allows traders to survive long enough for patterns to play out occasionally. Poor risk management guarantees failure, regardless of how good a pattern looks.

Free Candlestick Patterns PDF (Reference Only)
This page includes a free candlestick patterns PDF designed as a visual reference. It is useful for reviewing pattern names and recognizing common candle structures.
It is not a trading system and should not be used as one. The PDF works best after you already understand how patterns behave in real market conditions. Download it as a reference, not as a shortcut.
About This Guide and Methodology
This guide is based on long-term observation of price behavior across different markets, including indices, stocks, forex, and cryptocurrencies.
Candlestick patterns are treated as behavioral clues rather than mechanical rules. Market conditions change, volatility shifts, and patterns that once worked well can lose effectiveness.
For that reason, this content is reviewed and updated to reflect current market behavior rather than fixed theories.
Final Thoughts
Candlestick patterns remain popular because they are visual and intuitive. That does not make them reliable on their own.
Traders who struggle with candlestick patterns usually expect certainty, ignore context, or underestimate the importance of risk management.
Traders who use them effectively understand their limitations and treat them as one small piece of a much larger decision process. For deeper explanations of individual candlestick patterns, including detailed examples and failure scenarios, explore the dedicated pattern guides linked from this page.