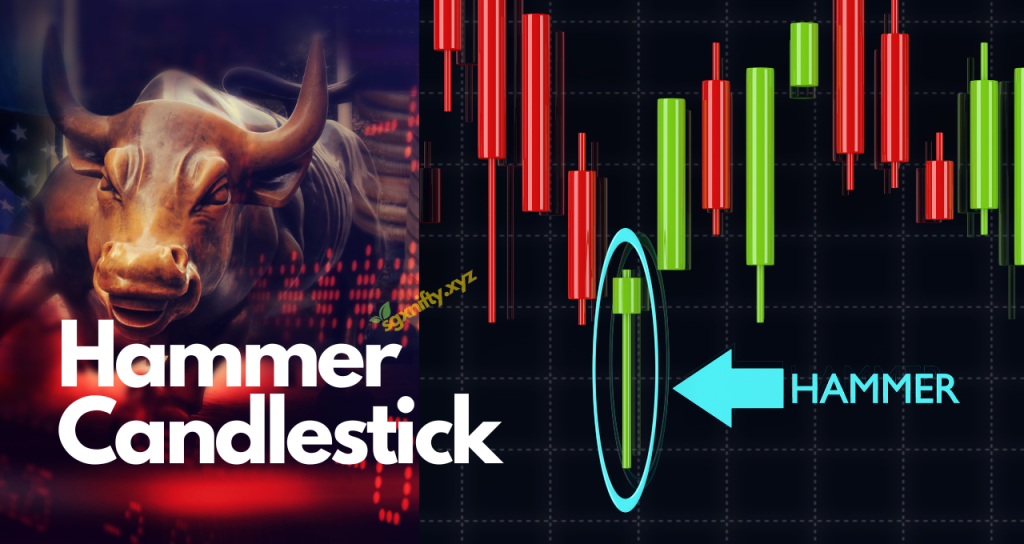
The stock market can be merciless with its ongoing red days, can’t it? Two decades in the industry has taught me to listen for the whispers hidden in the pandemonium.
One of the most effective warning signals I use is the hammer candlestick—a small body with a long shadow. It might be as straightforward as that, but don’t let its simplicity deceive you. This pattern has steered me toward many prospective bounces.
Let us leave aside the complex elements for now and discuss why the Hammer is still of immense importance.
If you’re looking for a complete reference, download our full PDF guide covering all candlestick patterns to deepen your technical analysis skills.”
It is rather obvious the market has a story to tell, and knowing that story can be very advantageous.
What is this pattern I have come to call ‘trustworthy’, this ‘Hammer‘ along with its sibling, the ‘Inverted Hammer‘? They suggest some significant changes are infact looming around the corner.
Have you ever wished the stock prices come back for a comeback? Well, these patterns provide perfect signals.
Let us see what the patterns signify and what useful information they could provide around the stock price and its possible movements.
What is a Hammer Candlestick Pattern?
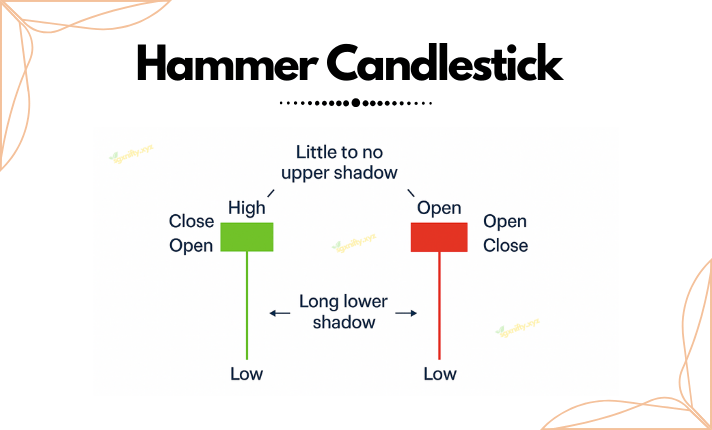
A candlestick hammer is a type of candlestick formed by a small real body at one end of the trading range together with a long wick (the hammer’s striking head) protruding from the other end;
Small real body: The range of the opening and closing price, a bearish candle is normally observed however if the body turns to be bullish, it increases the confidence of those analyzing the chart.
Long lower wick(for standard Hammer): Wicks are present at the lower and upper parts of the real body, this explains where they should be located. Standard hammber is ideally supposed to have a long lower wick whose length is at least two times the real body. This, according to traders, indicates a slight drop that is progressive during selling, but overwhelming force by buyers is what drives the price upward.
Little or no upper wick: In accordance to standard hammer definition, price action on the chart should not display a sizable upper wick on the hammer since this means that toward the close and the high of the day is around where the market is opened or is near.
The Hammer is just one of many reversal signals. If you want to understand others like Doji, Morning Star, or Engulfing, check out our comprehensive All Candlestick Patterns PDF.
In Doji candlesticks, the body is usuallyonly a thin line due to almost equal opening and closing prices. The Hammer candlestick has a slightly more defined, but still small, body.
What is an Inverted Hammer Candlestick Pattern?
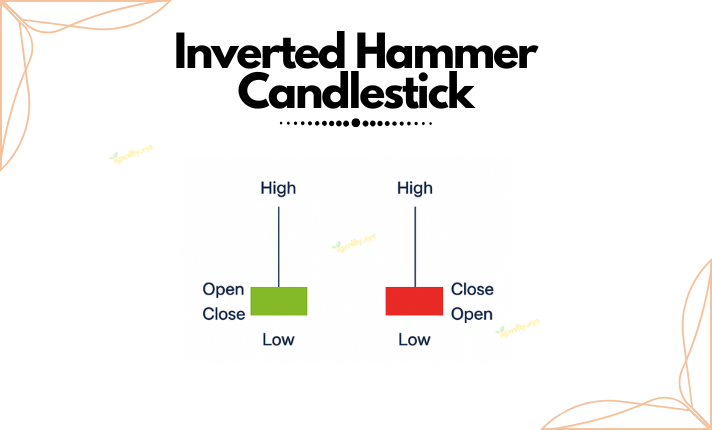
As the name suggests, the Inverted Hammer is an uptreand symbol that occurs after a downtrend, signaling a potential Bullish reversal.
Small Real Body: Located at the lower range of the highest, lowest price of a trade.
Long Upper Wick: This wick ought have a minimum length of double that of the real body. This demonstrates that the buyer did attempt to raise their price, but assorted pushed price down to where it is close to the lower range of the highest price of that transaction. Yet, one significant consideration to note is the fact that it was possible for the buyer to push the price above the above the lowest price of that transaction.
Little or No Lower Wick: Like already shown on the standard Hammer, lower or no lower wick is preferred to be absent or strickly minimal.
As far as I can tell, both the Hammer and Inverted Hammer suggest that there might be possible exhaustion of a downtrend. The long wick of both is indicative of a strong test of lower prices for the Hammer and a strong initial push upwards in the case of Inverted Hammer. However, it is the price action that follows which solidly confirms the reversal.
Hammer vs. Inverted Hammer
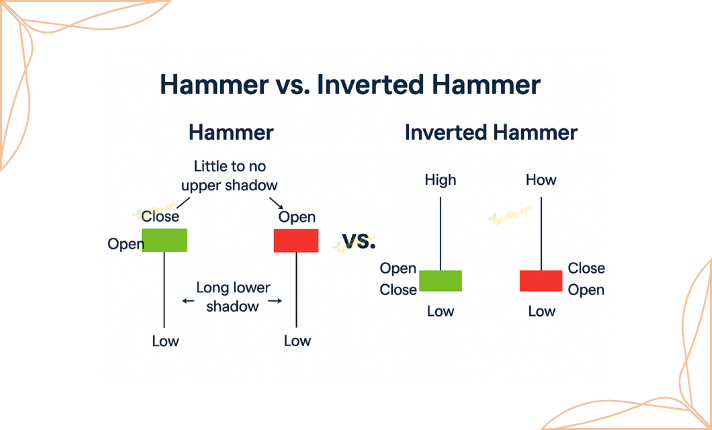
Both of these signals mark bullish reversals in downtrends, but an experienced trader might utilize them differently for reasons that are more granular.
Hammer: Long lower wick indicates that a lower price has been rejected strongly within the day. The price closing near the high (or open in the case of a red Hammer) commands immediate purchase power. Most traders tend to find a bullish (green) Hammer more convincing owing to the close.
Inverted Hammer: The price extending itself upwards to close near the high commands a bullish sentiment. But the price retreating to close near the low (or open) does tell us that there was not as much buying throughout the session as one would want compared to a standard Hammer. If you want to dive deeper into how seasoned traders confirm these candlestick patterns and build strategies around them, download The Candlestick Trading Bible (Free PDF). It’s a timeless resource packed with real chart examples, reversal setups, and insights into the psychology behind the candles.
How to Trade the Hammer and Inverted Hammer
Spotting a Hammer or Inverted Hammer is just the beginning. Here’s how seasoned traders deal with these patterns:
Confirmation is Key: This often trips up beginners. The initial pattern always needs some kind of confirmation in the next few trading sessions a higher mark that makes a bullish turnaround more probable. Don’t jump in just because you see a Hammer or Inverted Hammer pattern.
Watch for a move above the peak of the Hammer/Inverted Hammer on the next candle.
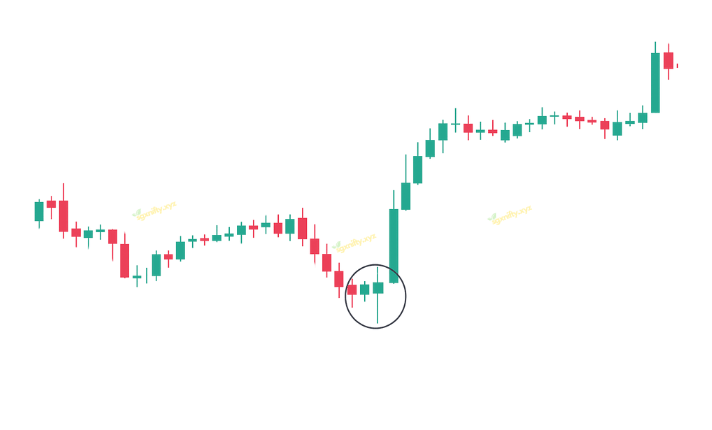
A candle that closes above the previous one is even more convincing if it happens to be a green bullish one.
Also pay attention to the volume on confirmation day. Higher volume paired with signs of a turnaround suggests a stronger chance that the reversal will occur.
Want to sharpen your ability to read subtle price action signals? Don’t miss our in-depth guide on the Inside Candle Pattern—a compact but powerful setup often seen before major breakouts. Combine it with the Hammer for stronger entries.
This extra information suggests a higher likelihood of the reversal taking place.
Context Matters: These patterns pack the biggest punch when they pop up at the tail end of a clear downtrend alongside key support levels (like past lows, trendline support, or Fibonacci retracement spots). It doesn’t make much sense when a Hammer shows its face in the middle of a choppy zone. Traders often monitor broader market sentiment and index movements, such as those provided by the National Stock Exchange of India (NSE), to gauge the overall environment
Stop-Loss settings: Smart risk management calls for a stop-loss. For a Hammer, it makes sense to put it just under the low point of the Hammer’s wick. With an Inverted Hammer, you’d want to place it right below the base of the candle’s body.
Hammer/Inverted Hammer Breakout Strategy
Entry Signal:
- Watch for a breakout above the high of the Hammer/Inverted Hammer in the subsequent candle.
- A strong bullish (green) candle closing above the high adds conviction.
- Volume matters on the confirmation day; greater volume indicates greater participation in the potential reversal.
Profit Targets:
- In your overall trading strategy and market environment, it is the identification of profit targets.
- Previous resistance levels, Fibonacci extensions, or other technical indicators can provide relevant areas for consideration.
Some Common Traps:
- Isolation Trading: Hammer trading is done without the intention of considering the broader market picture and other indicators-a sure recipe for disaster.
- Ignoring Volume: Low volume on Hammer and on its confirmation can weaken the signal.
- Impatience: When entering before a confirmation, the probability that one will see a false signal is increased.
- Confusing with Similar Patterns: As stated earlier, don’t mistake a Hammer at the top of an uptrend as a bullish sign (that would likely be a Hanging Man).
Hammer vs. Hanging Man and Shooting Star
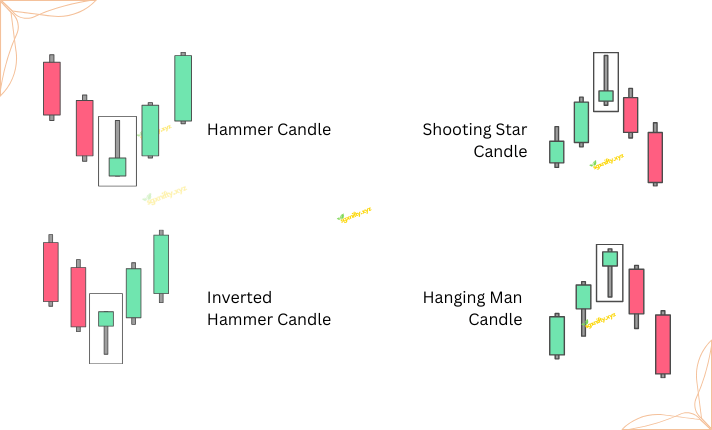
It is critical to clarify Hammer and Inverted Hammer from Hanging Man and Shooting Star patterns. They are structurally alike but imply something different based on what previously continued:
Hammer: Hammer is appearing in a downward trend and indicates the possibility of a bullish reversal.
Hanging Man: Hanging man is presenting in an uptrend, indicating the possibility of a bearish reversal.
Inverted Hammer: Inverted hammer is appearing in a downward trend, indicating the possibility of a bullish reversal.
Shooting Star: Shooting star is appearing in an uptrend and indicates the possibility of a bearish reversal.
The context of the trend is everything!
Ready to take your stock market skills to the next level? Don’t miss our handpicked list of the Best 8 Books for Learning the Stock Market—a must-read for every smart trader! 📚💹
Conclusion
Those two candlestick patterns-the Hammer and the Inverted Hammer can be considered good technical indicators for the technical trader because they are investigating bullish reversals after downtrends. Indicators, like these, are unable to bring any guarantee of good reversals. Instead, successful transmission relies on the conjunction of signals and a well-disciplined approach to risk management. This would help you find conformation, even if it’s with some other indicators or the overall market context. The strength of a solid trading plan must never be set aside. Truly mastering these patterns, taking note of their finer points, and being able to successfully combine them into your strategy allows for a more informed trading decision.
Frequently Asked Questions (FAQs)
Q1: So, what’s the deal with these Hammer and Inverted Hammer things?
A: Basically, when you see them pop up after a price has been falling for a while, they’re whispering that things might be about to turn around and head back up.
Q2: Are they a sure thing?
A: Nah, not really. They’re more like strong hints. Smart traders usually wait for other signs to back them up and always have a plan to bail if things don’t go their way.
Q3: Does it matter if the candle is red or green?
A: Interestingly, both red and green ones can signal a possible upward swing. But, a green one often feels a bit more convincing, like the buyers are really stepping in.
Q4: Where do these patterns usually show up?
A: You’ll typically spot them at the tail end of a downtrend, when the price has been on a downward slide.
Q5: Do they absolutely mean the price will go up?
A: Nope, not a guarantee. They just suggest a good chance of a reversal, but you need to see what happens next to be more sure.
Q6: How do you actually trade based on these?
A: Well, you usually wait for the next few candles to confirm the signal – like a strong upward move that breaks above the high of the Hammer or Inverted Hammer. Also, checking the trading volume can add confidence. And definitely set a “stop-loss” order to limit your losses if the price keeps falling.
Q7: What’s the story behind these shapes?
A: Think of it like this: with a Hammer, even though sellers pushed the price way down during the day, buyers came in strong and pushed it back up. With an Inverted Hammer, buyers tried to lift the price, but even though they couldn’t hold those highs, it shows sellers might be losing their grip.
Q8: How are they different from those Doji candles?
A: Dojis look really indecisive, with hardly any body. Hammers have a small but noticeable body.
Q9: What usually happens after one of these shows up?
A: Things can get a bit uncertain for a bit. The price might wobble around before it actually makes a clear move upwards.
Q10: Okay, so what exactly is a Hammer candlestick?
A: Imagine a candle with a small chunk at the top and a long tail (the wick) hanging down – at least twice as long as that top chunk. It shouldn’t have much or any “shadow” sticking out the top.
Q11: What does that long lower tail mean?
A: It shows that sellers tried hard to push the price lower, but buyers stepped in with force and drove it back up.
Q12: Is a Hammer always a good sign?
A: When you see it after a price drop, yeah, it’s usually a bullish signal. But, if you see a similar shape after a price increase, it’s called a “Hanging Man” and actually suggests a possible downturn.
Q13: If I see an Inverted Hammer when the price is already going up, is that good?
A: Nope. In that case, it’s called a Shooting Star and usually signals a possible drop in price.
Q14: And what’s an Inverted Hammer then?
A: It’s like the Hammer flipped upside down. You’ve got a small body at the lower end of the day’s price range and a long “shadow” sticking up, again, at least twice the size of the body, with little to no shadow below.
Q15: How does this upside-down Hammer hint at a reversal?
A: That long upper shadow shows buyers tried to push the price higher. They couldn’t keep it there, but the fact they tried suggests the sellers might be losing control, opening the door for a potential rise.
Q16: How is an Inverted Hammer different from a Shooting Star?
A: They look alike – small body, long upper shadow. But the key difference is where they appear. An Inverted Hammer shows up after a downtrend (bullish), while a Shooting Star appears after an uptrend (bearish).
